Adobe Journey Optimizer B2B
I started at Marketo in 2016, which was acquired in 2018 by Adobe. The Marketo Account Based Management product was already widely adopted and beloved, but it was a hodgepodge of parts made from previous code mergers. It was ready for a major upgrade. I was hired to join the team creating a whole new version of the software, moving from an out of date ExtJS framework to a state-of-the-art React Web Application.
Through change of leadership and course, we had a few starts and stops in creating the new iteration of the product. I continued to help maintain the legacy product to support the many users using it in their daily worklives.
Ultimately, Marketo would evolve to be a part of Adobe Experience Cloud, and we took what we had built and converted it over to Adobe Journey Optimizer B2B Edition. Utilizing many of the same APIs and creating a few key new ones, we were able to launch in just one year, feature complete in two years.
My core team had a high degree of ownership and leadership, ensuring that best practices we established were followed by global support teams.
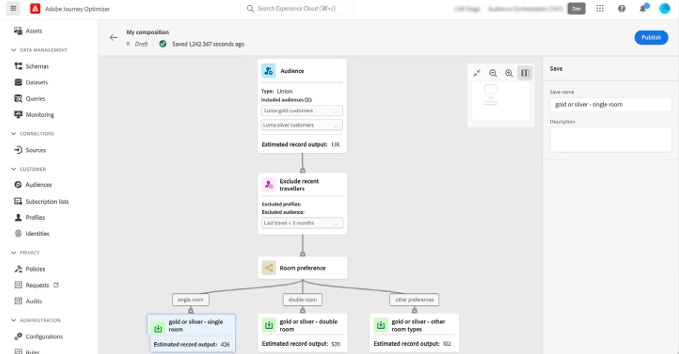
The product features many forms, drag and drop interfaces, and insightful dashboards utilizing AI analysis.
Savanna Example
Savanna was the primary product offering of Thetus, the company I worked with for over 3 and half years. I started as a theming expert, and developed into a full-fledged Front End Developer, taking on many responsibilities over the years. I was known as a strong liaison to the Design Team and as a styling expert, and as someone who was eager to dig deep and understand how the view is delivered in order to constantly improve the user’s experience.
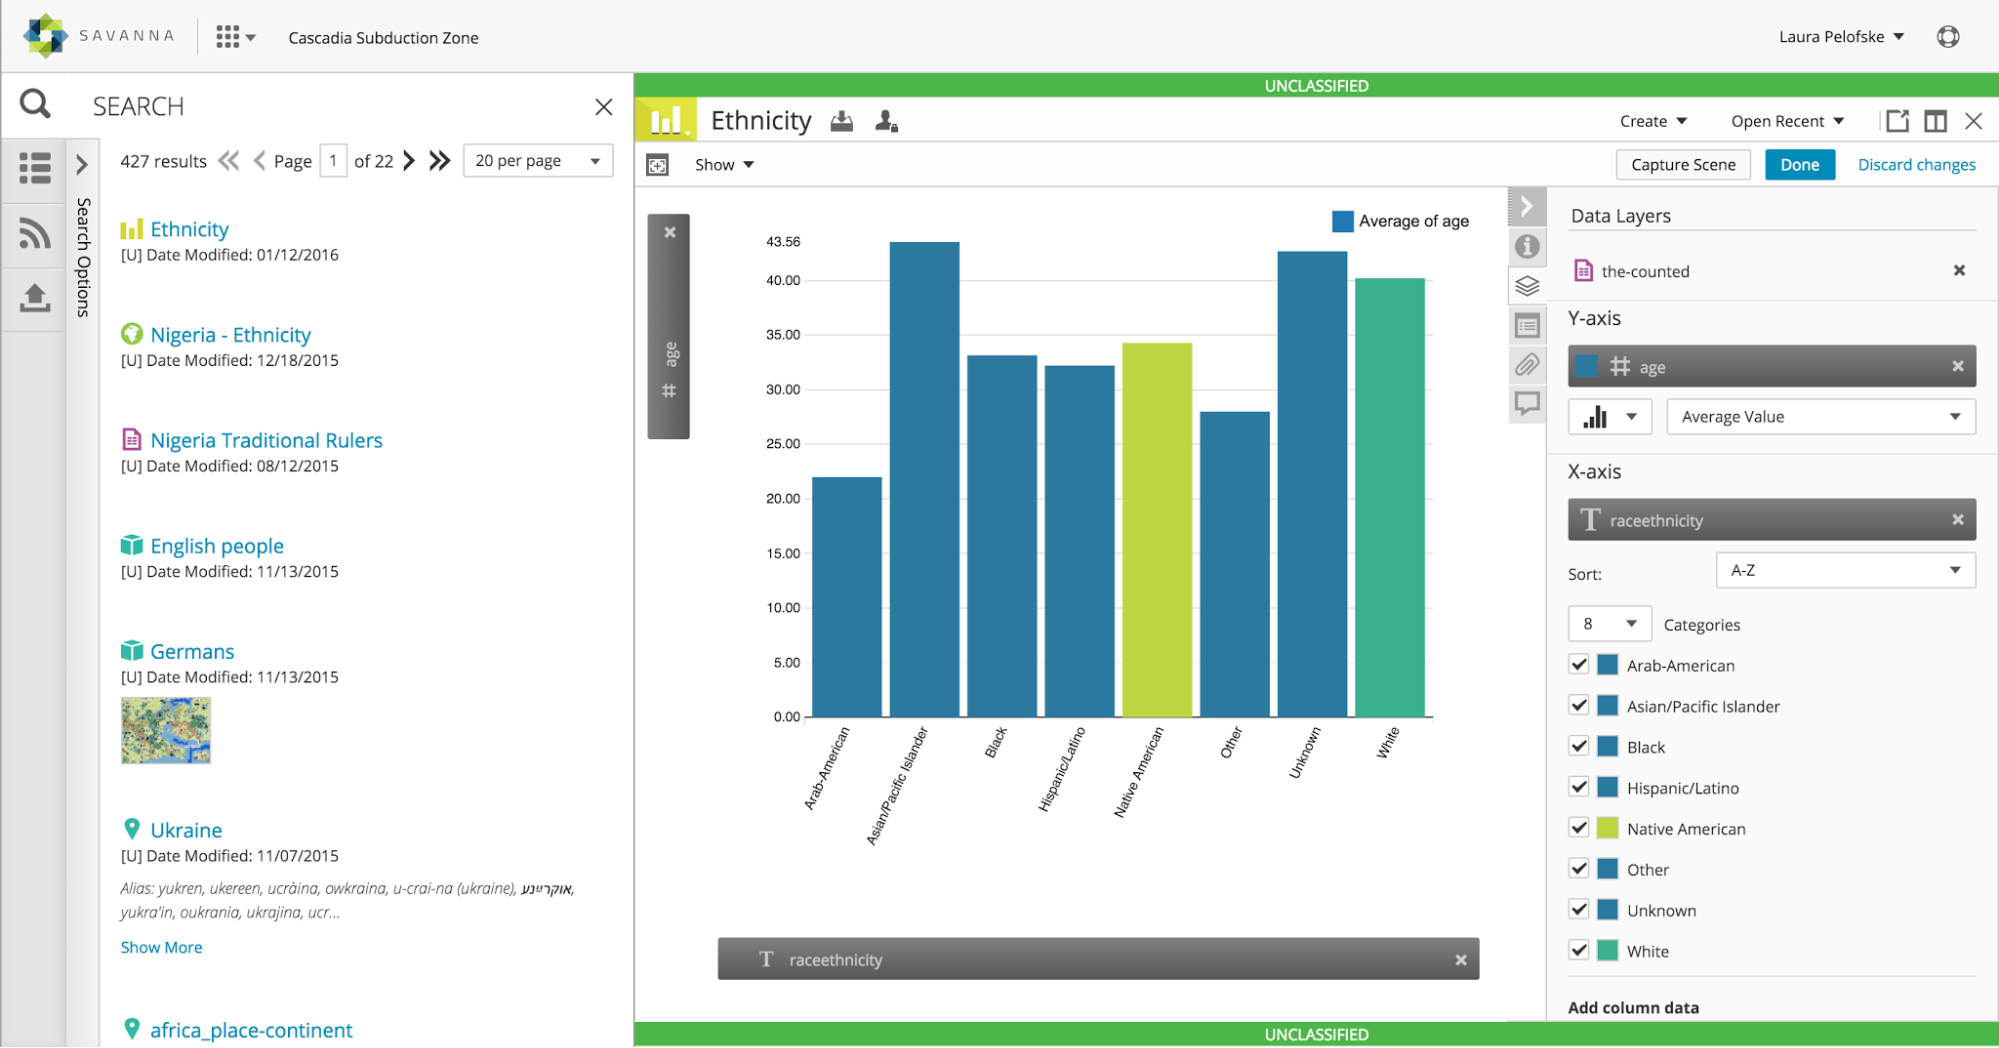
One of the projects I worked on in Savanna was “Graphics,” a module that enables users to control the graphical output of their uploaded CSV spreadsheets. Users can drag a “Grid” from search results or a .csv from their filesystem onto the workspace, and then will see the columns represented as draggable entities that can be dragged onto the graph to display the data visually. Many changes could be made: Users could deselect data rows so they are not represented in the graph, change the color of the data representation of each row, limit the number of rows represented and sort them,and could change the names of the axes in the final graph.
I was responsible for visual aspects, all done in SASS/CSS3, and functionality, done in JavaScript within the ExtJS framework. Every icon you see here is generated through a custom font, in the style of FontAwesome. The only images here are the logo and the image in the search results. It was important to keep the rendering to a minimum because visualizations could get very complex. I regularly communicated with the in-house visual designer to make sure what I created was what he envisioned, and to find out if he wanted to change anything once he saw it in action. I worked closely with the UX team as well. This interface is very interactive, and every micro-interaction deserved scrutiny. The graph itself was generated using D3js, a javascript library that converts data into SVG representation. There were many layers to this project, from designing the JSON object that held changes users made, to refining the D3 code to suit our users’ needs.